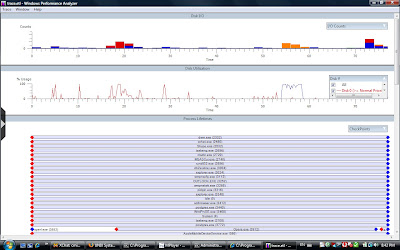
The toolkit includes xperf - a trace capture tool, xperfview - a visualization tool (Performance Analyzer) and xbootmgr - a boot trace capture tool.
It works great along side sysinternals tools (Process Explorer and Process Monitor) and krview for kernel tracing and profiling and Performance Monitor (perfmon.msc).
Here's a VERY simple trace (xperf -on DiagEasy, xperf -d trace.etl, xperf trace.etl). There's hunderds of knobs you can turn. You can use it for everything from getting VERY detailed system information (xperf –i trace.etl –a sysconfig) to getting advanced disk I/O info or pinpointing Registry Access bottlenecks.

No comments:
Post a Comment