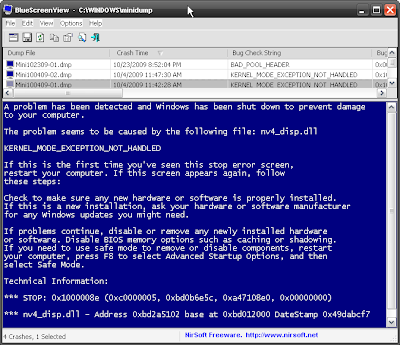
Sure, you can do a lot more than a simple !analyze -v with WinDbg, but if you're doing tech support and keep getting spammed by minidumps or just want to solve something quick and easy, you can use BlueScreenView.
Basically, you can see the drivers found on the stack at the time of the crash, a list of all drivers loaded in the kernel or XP style BSOD as it would appear in the crash. You can also create HTML reports to send to your clients.

The process is simple. You point BSV at a bunch of minidumps, you look at what driver is on the stack - then you upgrade it (oh, look, it's NVIDIA, time to upgrade). Or uninstall it (oh, look, I'm running some daemon tools thing pseudo-driver, to time remove it). Then you see if Windows stops crashing. If not, go to plan B - WinDbg, Driver Verifier, etc.


2 comments:
why not open the minidump with windbg, or using dumpchk.exe in a shell (both run as admin)? for the command to work in a terminal, you either navigate to the appropriate directory, or edit the PATH variable and add the windbg install folder to it
Because it's easier and faster to use this, especially when dealing with high volumes of memory dumps. WinDBG is for advanced users who need to perform detailed analysis.
Post a Comment