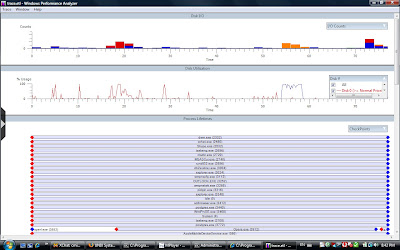
Windows Performance Tools Kit, v.4.1.1 helps diagnostic application start time issues, boot issues, deferred procedure calls and interrupt activity (DPCs and ISRs), interrupt storms, application resource usage and system responsiveness issues.
The toolkit includes xperf - a trace capture tool, xperfview - a visualization tool (Performance Analyzer) and xbootmgr - a boot trace capture tool.
It works great along side sysinternals tools (Process Explorer and Process Monitor) and krview for kernel tracing and profiling and Performance Monitor (perfmon.msc).
Here's a VERY simple trace (xperf -on DiagEasy, xperf -d trace.etl, xperf trace.etl). There's hunderds of knobs you can turn. You can use it for everything from getting VERY detailed system information (xperf –i trace.etl –a sysconfig) to getting advanced disk I/O info or pinpointing Registry Access bottlenecks.
Saturday, February 09, 2008
Windows Performance Tracing Toolkit
Posted by
cmihai
at
8:19 PM
![]()
Labels: Debugging, Microsoft, Software Development
Subscribe to:
Post Comments (Atom)


0 comments:
Post a Comment